Extracting and Filtering Minima and Maxima of 1D Functions
Persistence1D is a class for finding local extrema and their persistence in one-dimensional data. Local minima and local maxima are extracted, paired, and sorted according to their persistence.
The code runs in O(n log n) time, where n is the number of input points.
In order to smooth noisy input data, the tool is best paired with Reconstruct1D: a tool for topology-based smoothing of one-dimensional data. This allows to create a smooth function that only contains the high-persistence minima/maxima.
The package supports C++, Python, and Matlab.
The C++ and Matlab versions of Persistence1D have been written by Yeara Kozlov and Tino Weinkauf, Max Planck Institute for Informatics, Saarbrücken, Germany. The Python version has been written by Tino Weinkauf, KTH Royal Institute of Technology, Stockholm, Sweden. You may use it as you wish, it is in the public domain. If you find it useful, it would be nice to hear from you. Just drop us a line.
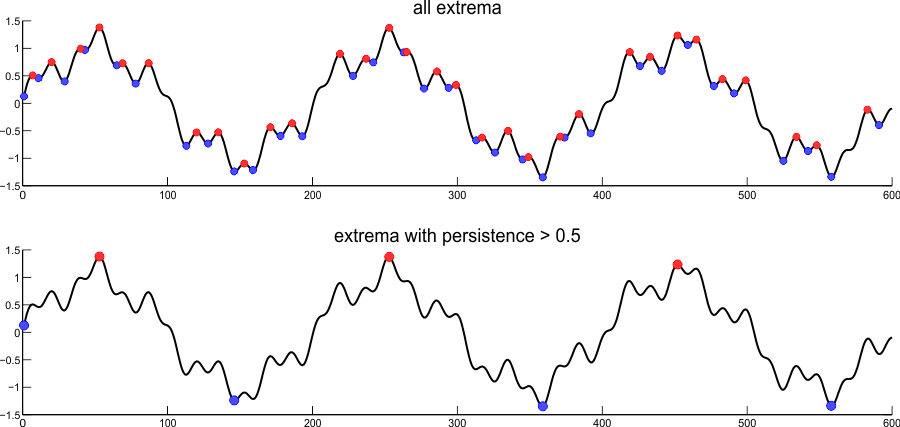
Persistence1D detects all local minima and maxima. It pairs them according to persistence. Subsequent filtering reveals the most dominant local extrema of the function.
Overview
The algorithm is available in C++, Python, and Matlab:
- C++: all relevant code is found in a single header file for simple inclusion in other projects. The only dependency is the C++ standard library.
- Python: only a single import statement is required. The only dependency is the numpy library for convenience reasons.
- Matlab: the code can be used from within Matlab via mex, i.e., it uses the C++ code in the background. There is also a command line program to quickly process text files with data.
Input
- One-dimensional vector of float values. It is assumed that this represents the function values of a one-dimensional function.
Output
- Indices of minima and maxima points.
- Persistence of the minima and maxima points.
If desired, the output can be filtered by a persistence threshold and adjusted to use the 1-indexing convention (e.g., for Matlab).
Example for C++
The following example shows how simple it is to use this class. It is practically one function call.
The C++ code can be found in the src/persistence1d folder.
#include "persistence1d.hpp"

using namespace std;
using namespace p1d;

int main()
{
    //Create some data
    vector< float > data;
    data.push_back(2.0);   data.push_back(5.0);   data.push_back(7.0);
    data.push_back(-12.0); data.push_back(-13.0); data.push_back(-7.0);
    data.push_back(10.0);  data.push_back(18.0);  data.push_back(6.0);
    data.push_back(8.0);   data.push_back(7.0);   data.push_back(4.0);

    //Run persistence on data - this is the main call.
    Persistence1D p;
    p.RunPersistence(data);

    //Get all extrema with a persistence larger than 10.
    vector< TPairedExtrema > Extrema;
    p.GetPairedExtrema(Extrema, 10);

    //Print all found pairs - pairs are sorted ascending wrt. persistence.
    for(vector< TPairedExtrema >::iterator it = Extrema.begin(); it != Extrema.end(); it++)
    {
        cout << "Persistence: " << (*it).Persistence
             << " minimum index: " << (*it).MinIndex
             << " maximum index: " << (*it).MaxIndex
             << std::endl;
    }

    //Also, print the global minimum.
    cout << "Global minimum index: " << p.GetGlobalMinimumIndex()
         << " Global minimum value: " << p.GetGlobalMinimumValue() << endl;

    /*
        Note that filtering and printing can also be done with one single function call:
        p.PrintResults(10);
    */

    return 0;
}
Running the code from above yields this output:
Persistence: 14 minimum index: 11 maximum index: 7Global minimum index: 4 Global minimum value: -13
Example for Python
The Python version is a re-implementation and much more straightforward. It is a simple function which returns a list of all minima and maxima with their persistence. Odd entries in that list are minima, even entries are maxima. The last entry is the global minimum. Adjacent entries 2*i and 2*i+1 are a minimum/maximum persistence pair.
The Python code can be found in the python folder.
import numpy as np
from persistence1d import RunPersistence

#~ Set the data directly in code
InputData = np.array([2.0, 5.0, 7.0, -12.0, -13.0, -7.0, 10.0, 18.0, 6.0, 8.0, 7.0, 4.0])

#~ This simple call is all you need to compute the extrema of the given data and their persistence.
ExtremaAndPersistence = RunPersistence(InputData)

#~ Keep only those extrema with a persistence larger than 10.
Filtered = [t for t in ExtremaAndPersistence if t[1] > 10]

#~ Sort the list of extrema by persistence.
Sorted = sorted(Filtered, key=lambda ExtremumAndPersistence: ExtremumAndPersistence[1])

#~ Print to console
for i, E in enumerate(Sorted):
    strType = "Minimum" if (i % 2 == 0) else "Maximum"
    print("%s at index %d with persistence %g and data value %g" % (strType, E[0], E[1], InputData[E[0]]))
Running the code from above yields this output:
Minimum at index 11 with persistence 14 and data value 4Maximum at index 7 with persistence 14 and data value 18Minimum at index 4 with persistence inf and data value -13
Example for Matlab
The matlab interface is just as convenient and the results are easily plotted. The result of this script is one of the plots from above.
The matlab code can be found in the matlab folder.
% Compile the mex file.
mex run_persistence1d.cpp

% Generate some data
x = 1:600;
SineLowFreq = sin(x * 0.01 * pi);
SineMedFreq = 0.25 * sin(x * 0.01 * pi * 4.9);
SineHighFreq = 0.15 * sin(x * 0.01 * pi * 12.1);
data = SineLowFreq + SineMedFreq + SineHighFreq;

% Input should be in SINGLE precision
single_precision_data = single(data);

% Call persistence1d - this is the main call
[minIndices maxIndices persistence globalMinIndex globalMinValue] = run_persistence1d(single_precision_data);

% Set a threshold for filtering the result
threshold = 0.5;

% Use filter_features_by_persistence to filter the pairs
persistent_features = filter_features_by_persistence(minIndices, maxIndices, persistence, threshold);
filteredMinima = [persistent_features(:,1) ; globalMinIndex];
filteredMaxima = persistent_features(:,2);

% Plot only features with persistence > threshold.
figure;
plot(data, '-k', 'LineWidth', 2);
title(strcat('extrema with persistence > ', num2str(threshold)));
hold on;

% Add a scatter plot for the filtered minima
plot(filteredMinima, data(filteredMinima), 'o', 'MarkerSize', 9, 'MarkerFaceColor', [0.3 0.3 1], 'MarkerEdgeColor', [0 0 1]);

% Add a scatter plot for the filtered maxima
plot(filteredMaxima, data(filteredMaxima), 'o', 'MarkerSize', 9, 'MarkerFaceColor', [1 0.2 0.2], 'MarkerEdgeColor', [1 0 0]);

hold off;
Documentation
The download package comes with extensive documentation and examples.
Download
The C++ and Matlab versions of Persistence1D have been written by Yeara Kozlov and Tino Weinkauf, Max Planck Institute for Informatics, Saarbrücken, Germany. The Python version has been written by Tino Weinkauf, KTH Royal Institute of Technology, Stockholm, Sweden. You may use it as you wish, it is in the public domain. If you find it useful, it would be nice to hear from you. Just drop us a line.